How to make a simple Dashboard with Apache Superset (Part 2)
In the previous article How to make a simple Dashboard with Apache Superset (Part 1), I instructed how to connect your Datasource to Superset. In today's article, I will start exploiting data from my data source by designing vivid Charts and Dashboards.
1. Create Dataset from Datasource
After successfully connecting from Superset to our data source, we need to create Dataset.
Select the Datasets menu right above the main screen
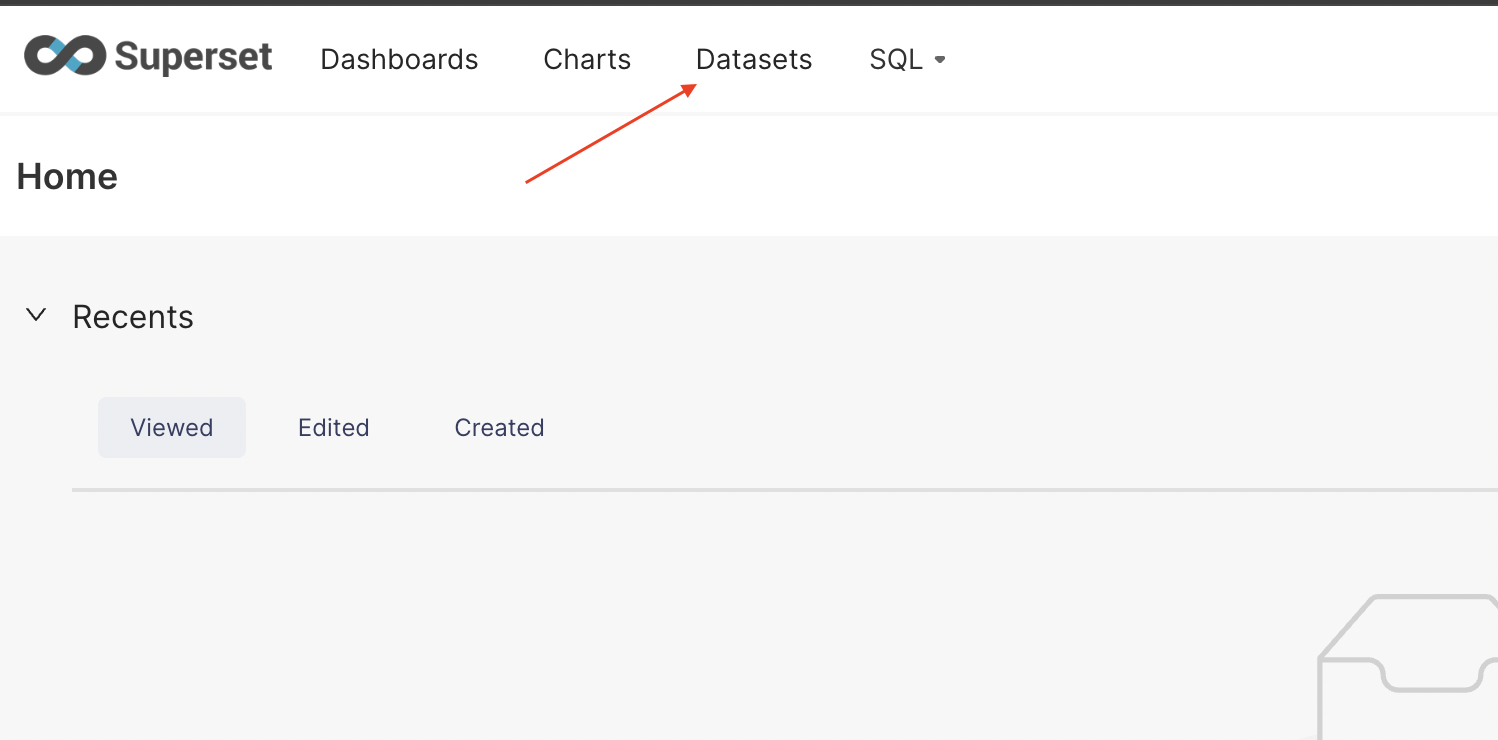
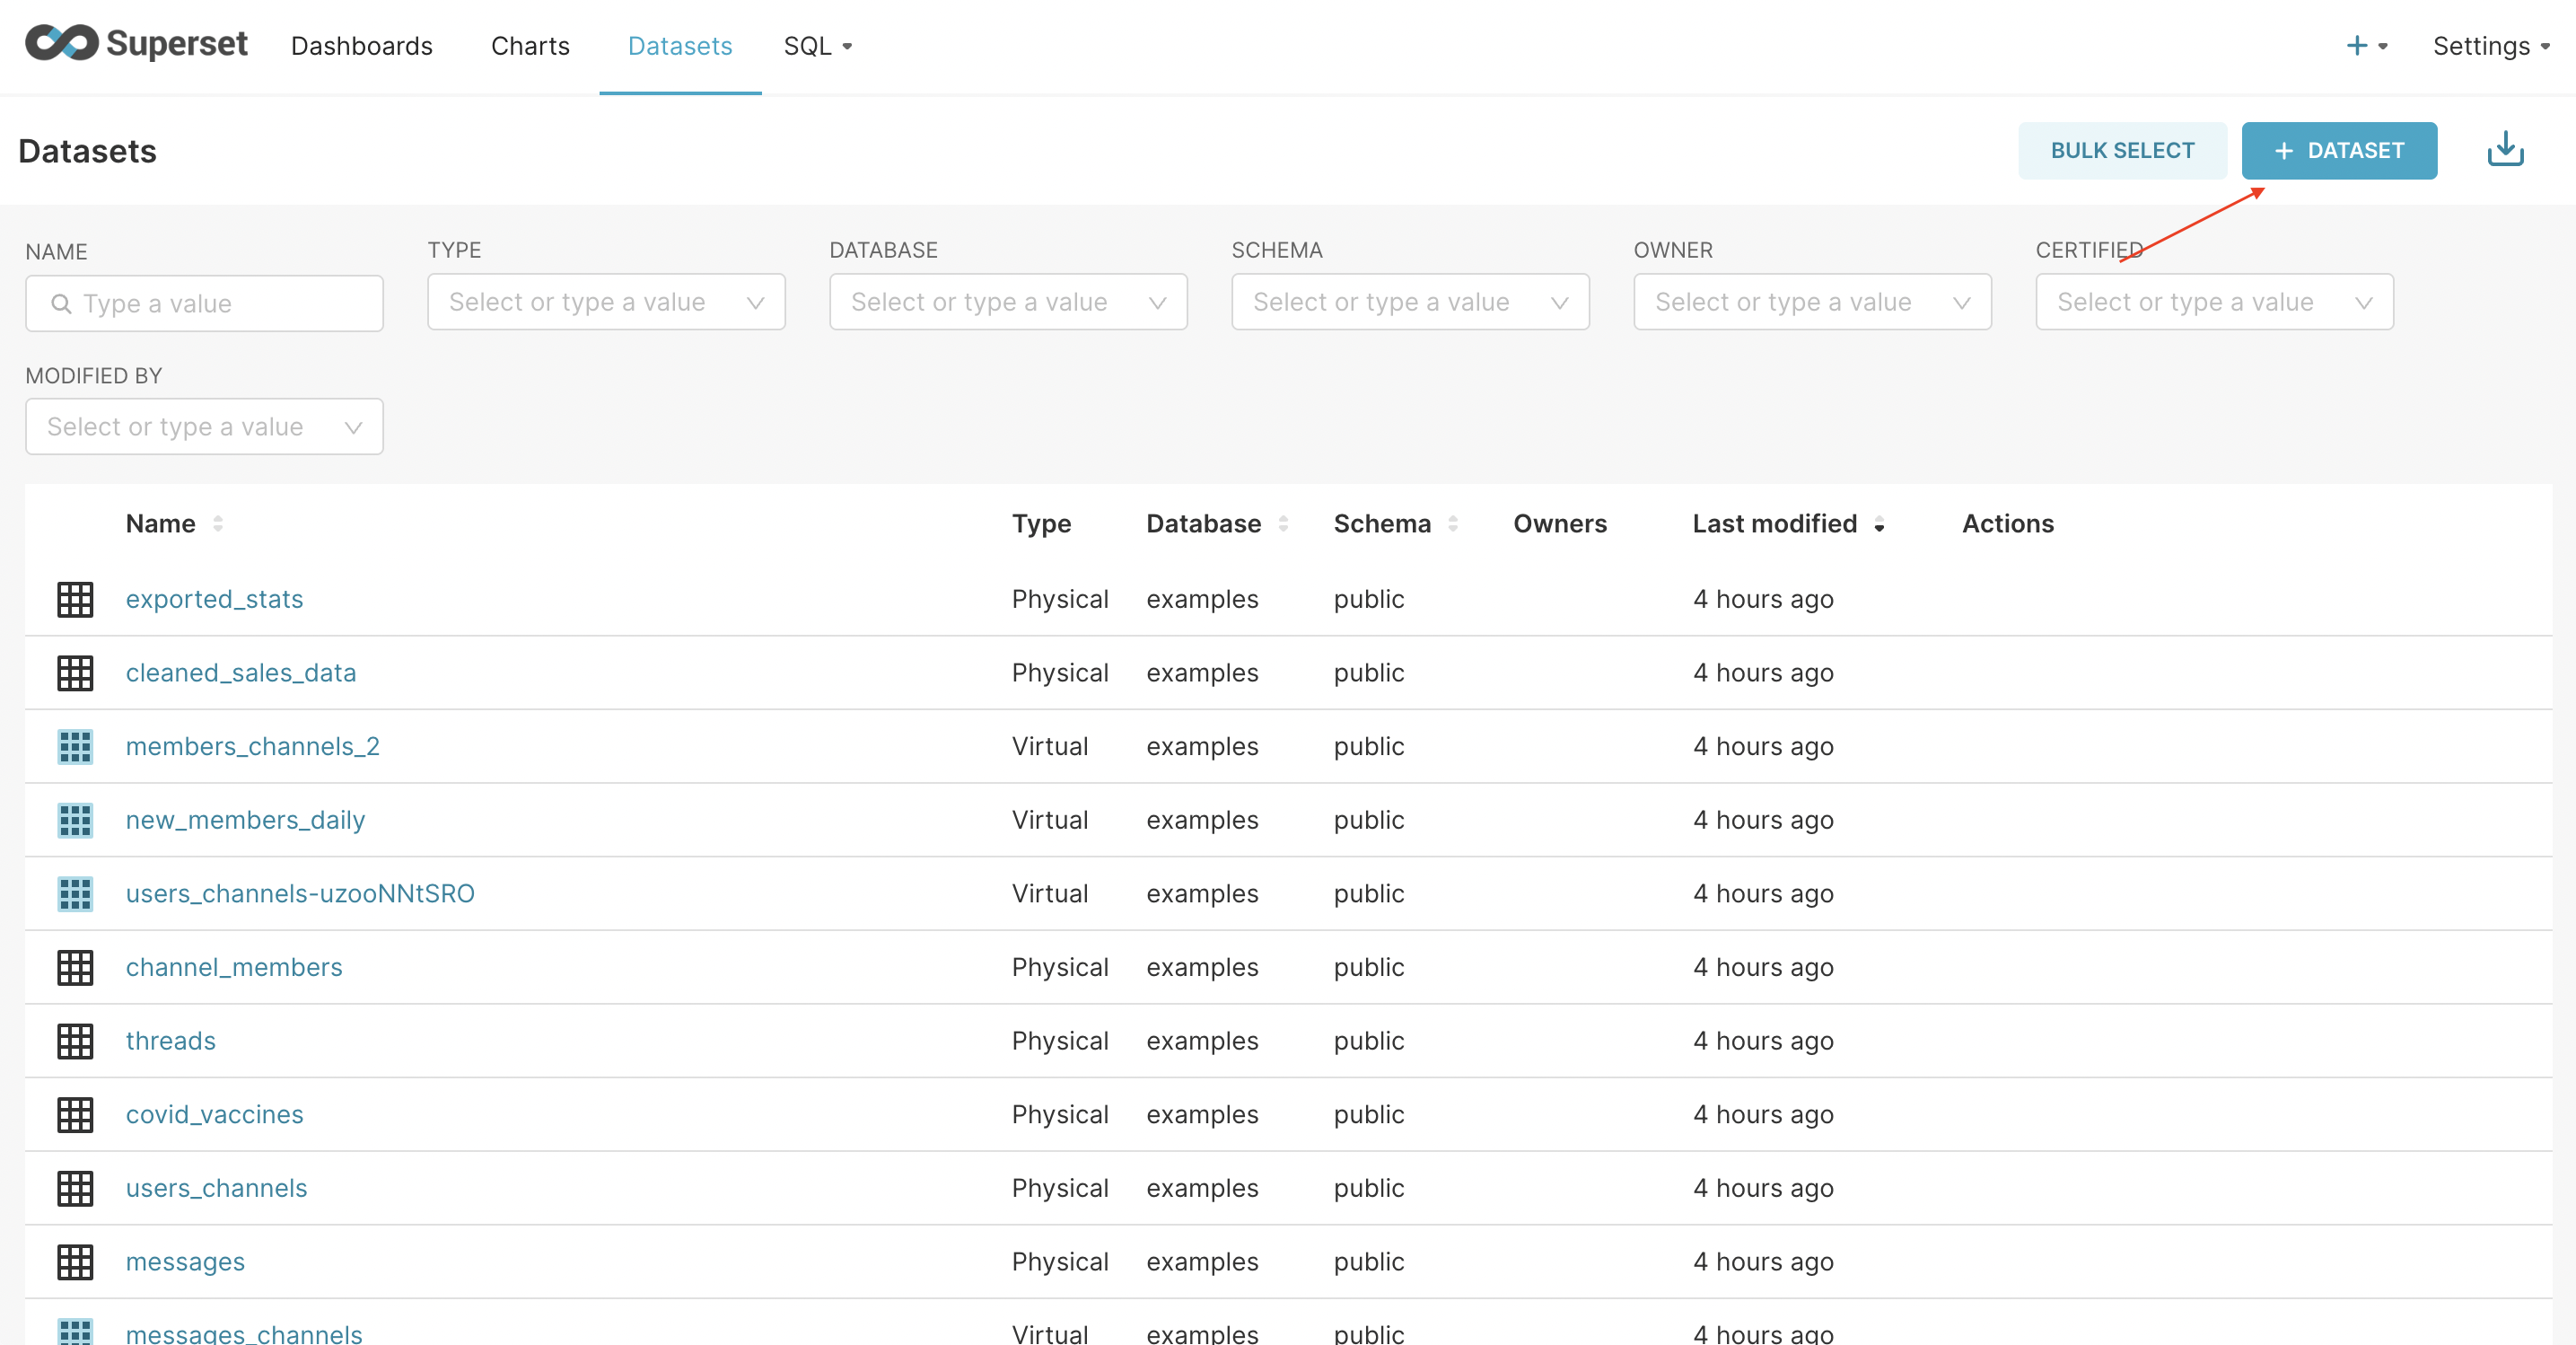
When opened, you will see all the current Datasets in the system. Click on the + Dataset button to add a new dataset.
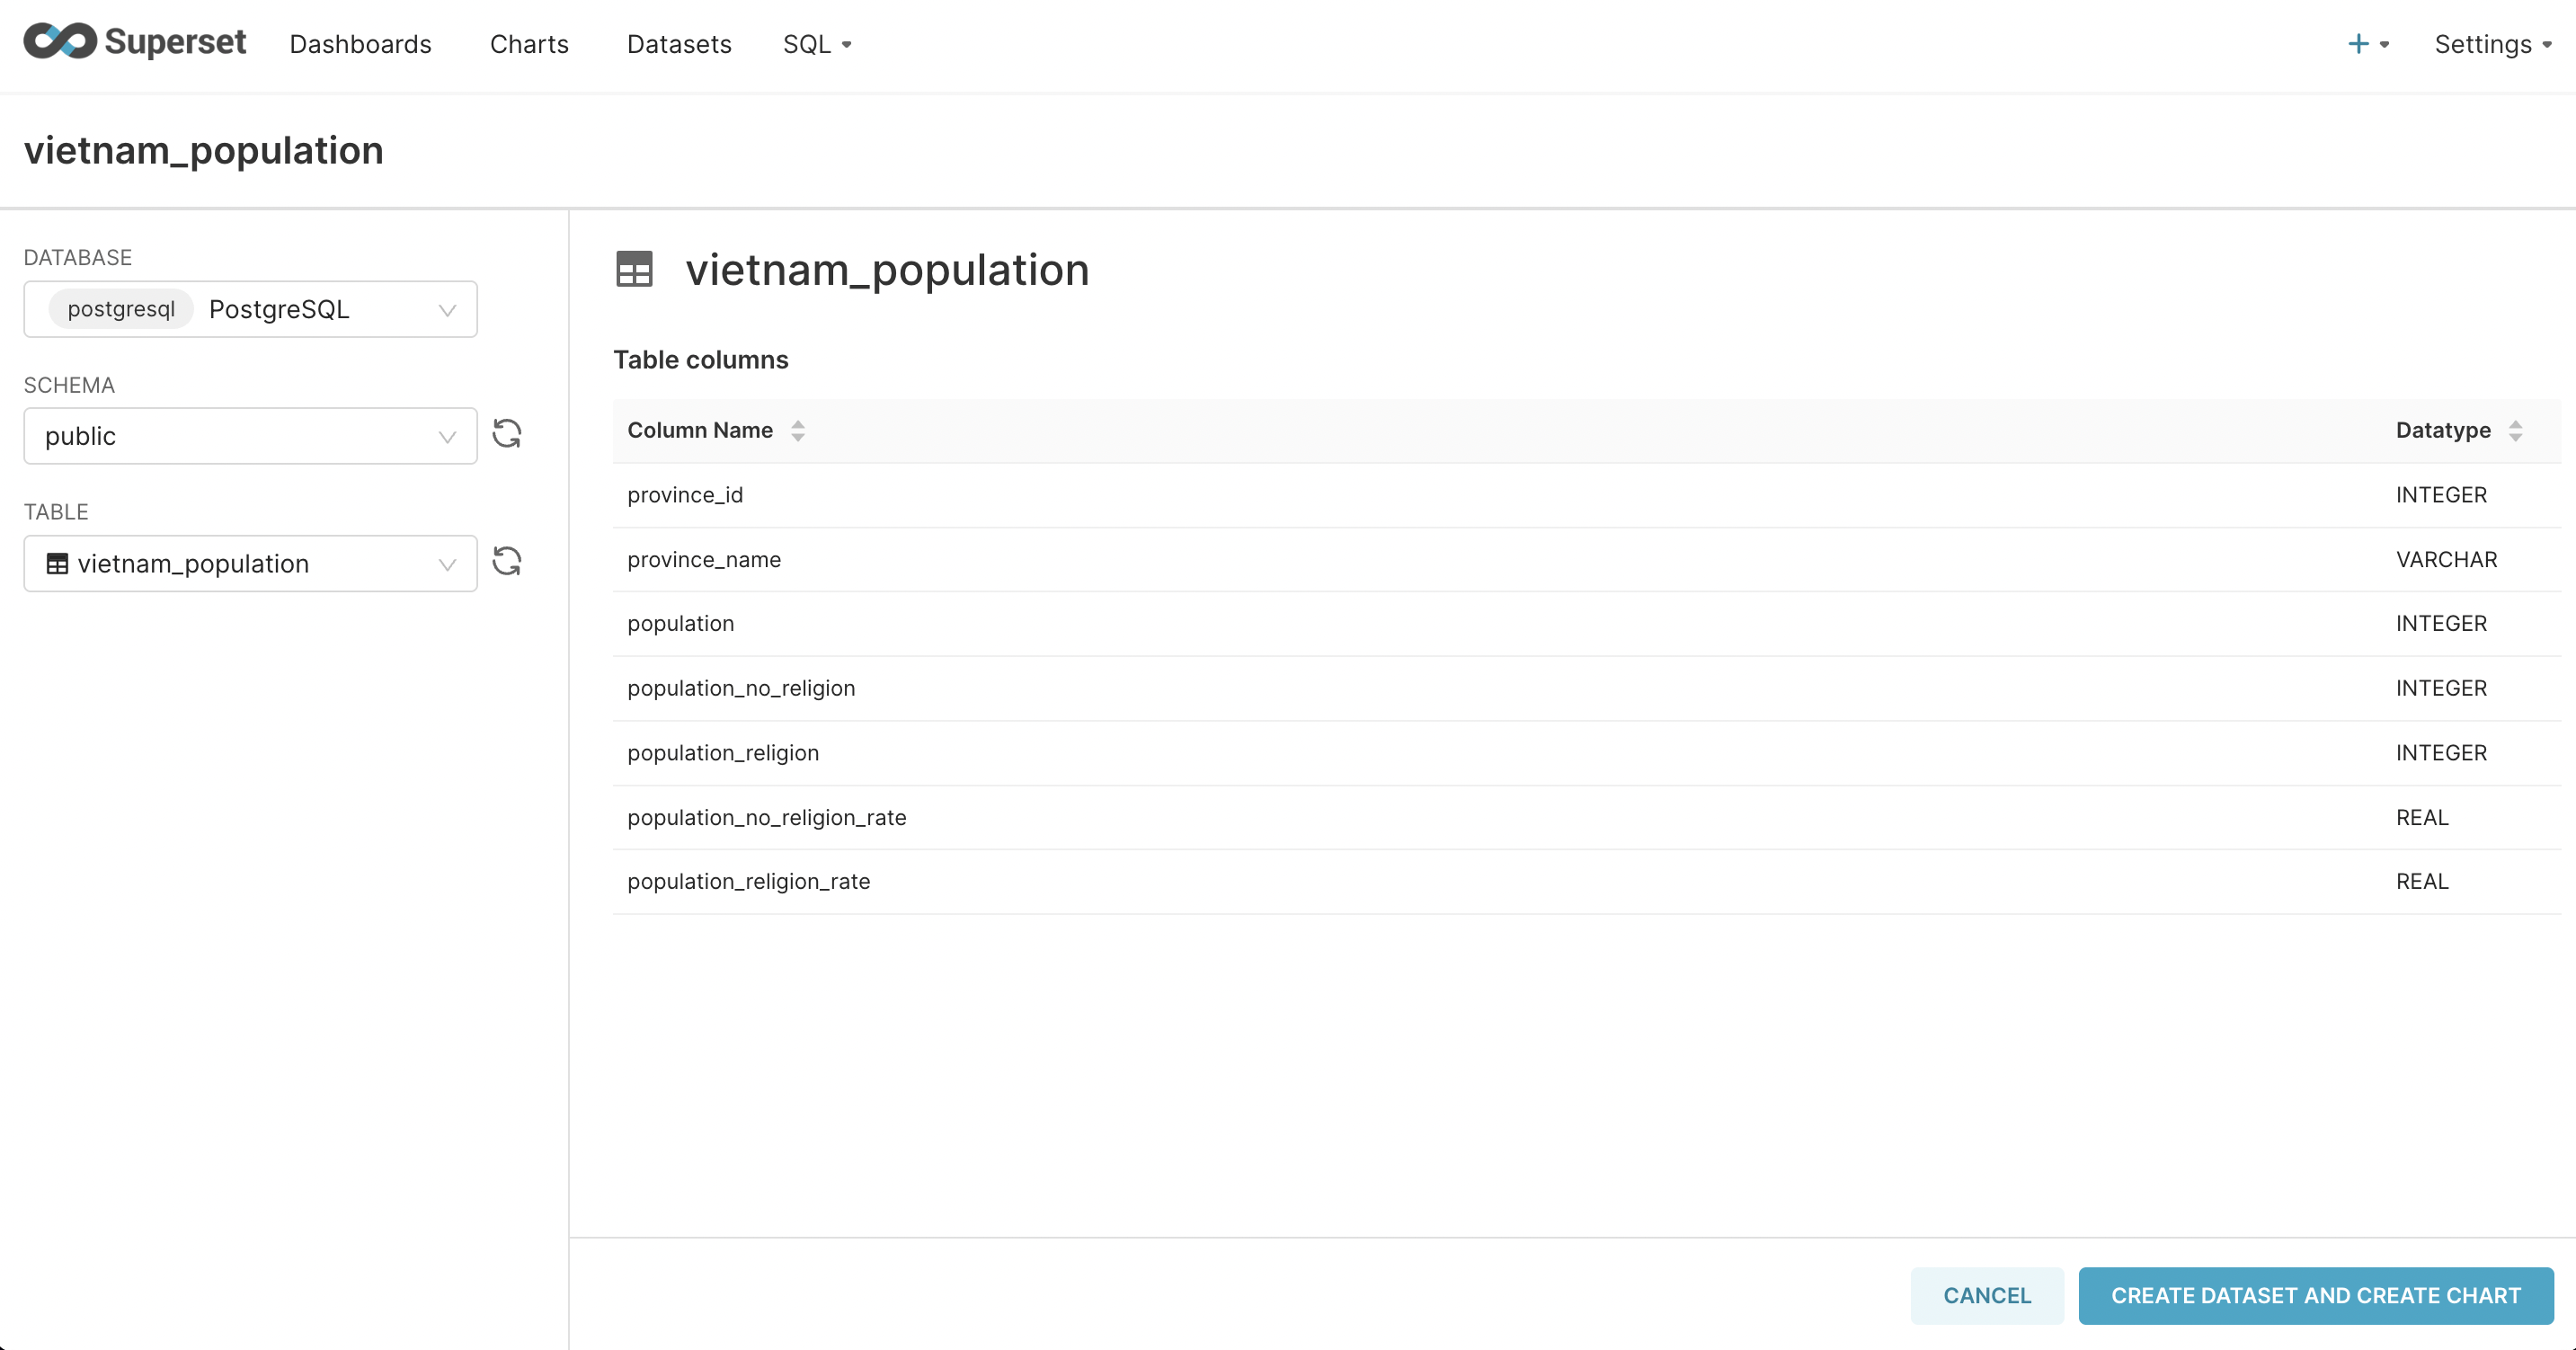
The Superset's dataset must come from a table, view under your Datasource, or you can also create a Dataset from a test query on SQLab. Then click Create dataset and create chart
2. Create a Dashboard and chart from the dataset
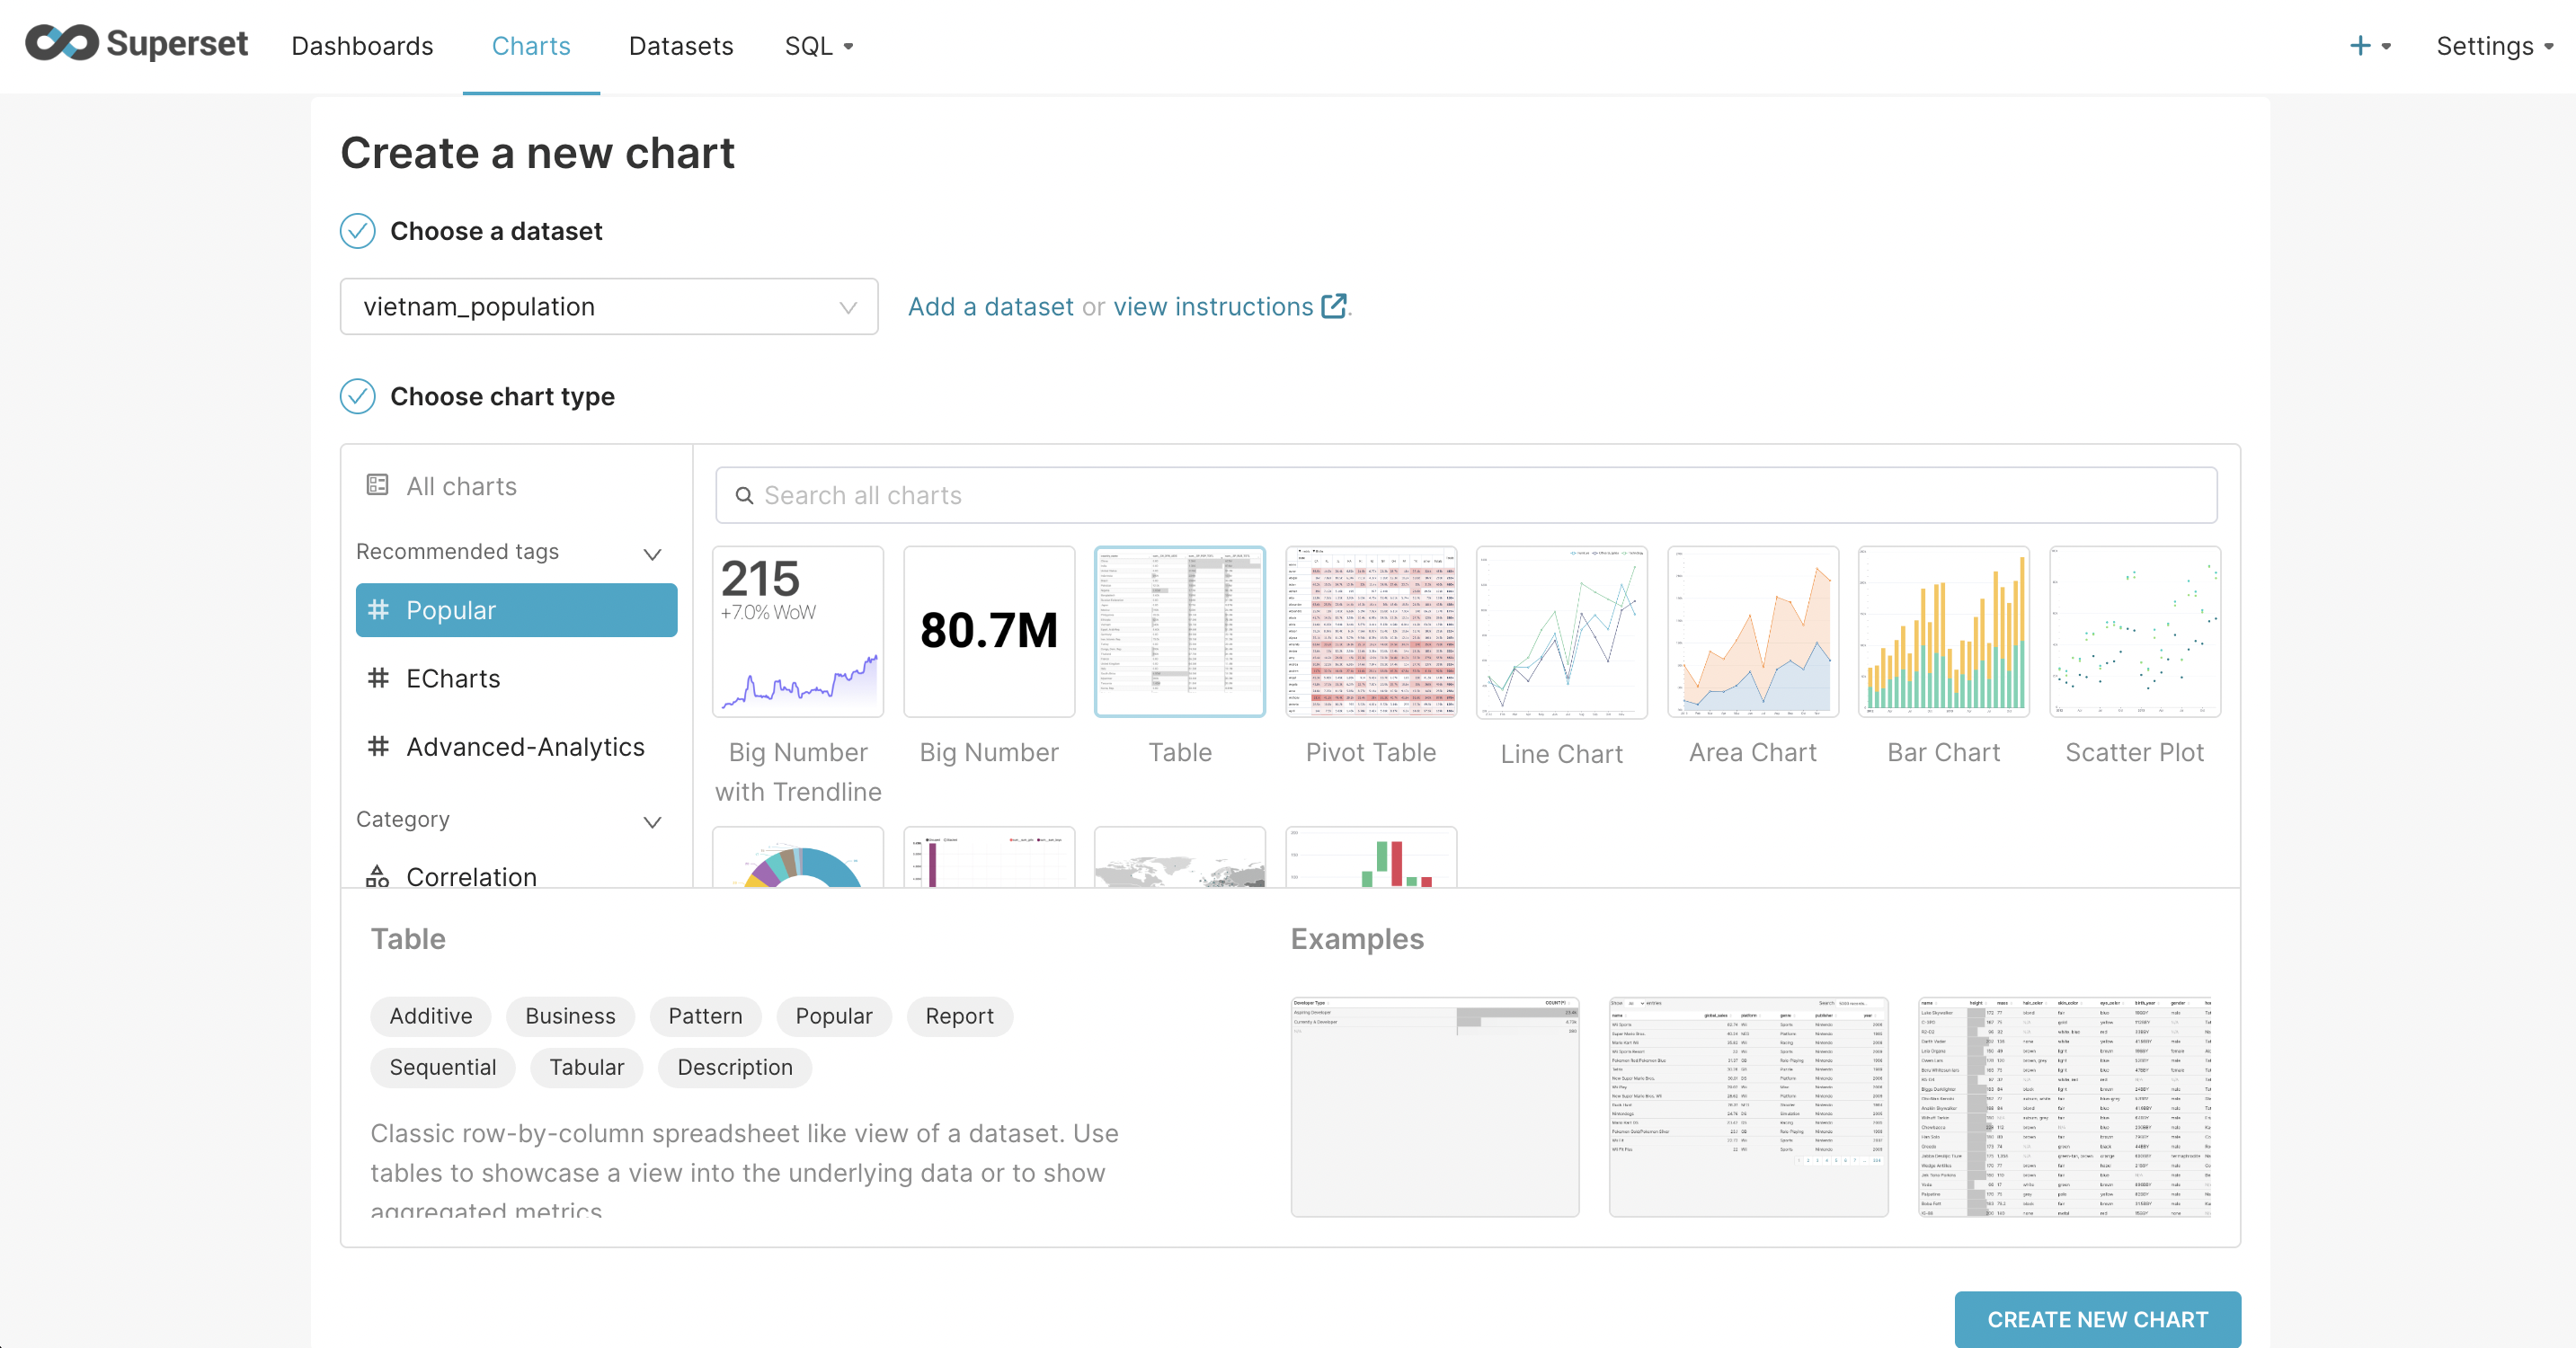
After creating a Dataset, the system will transfer you to the page to create charts. Here, you will choose a chart that is suitable for your data source. The simplest way is to choose Table. After selecting, click Create new chart
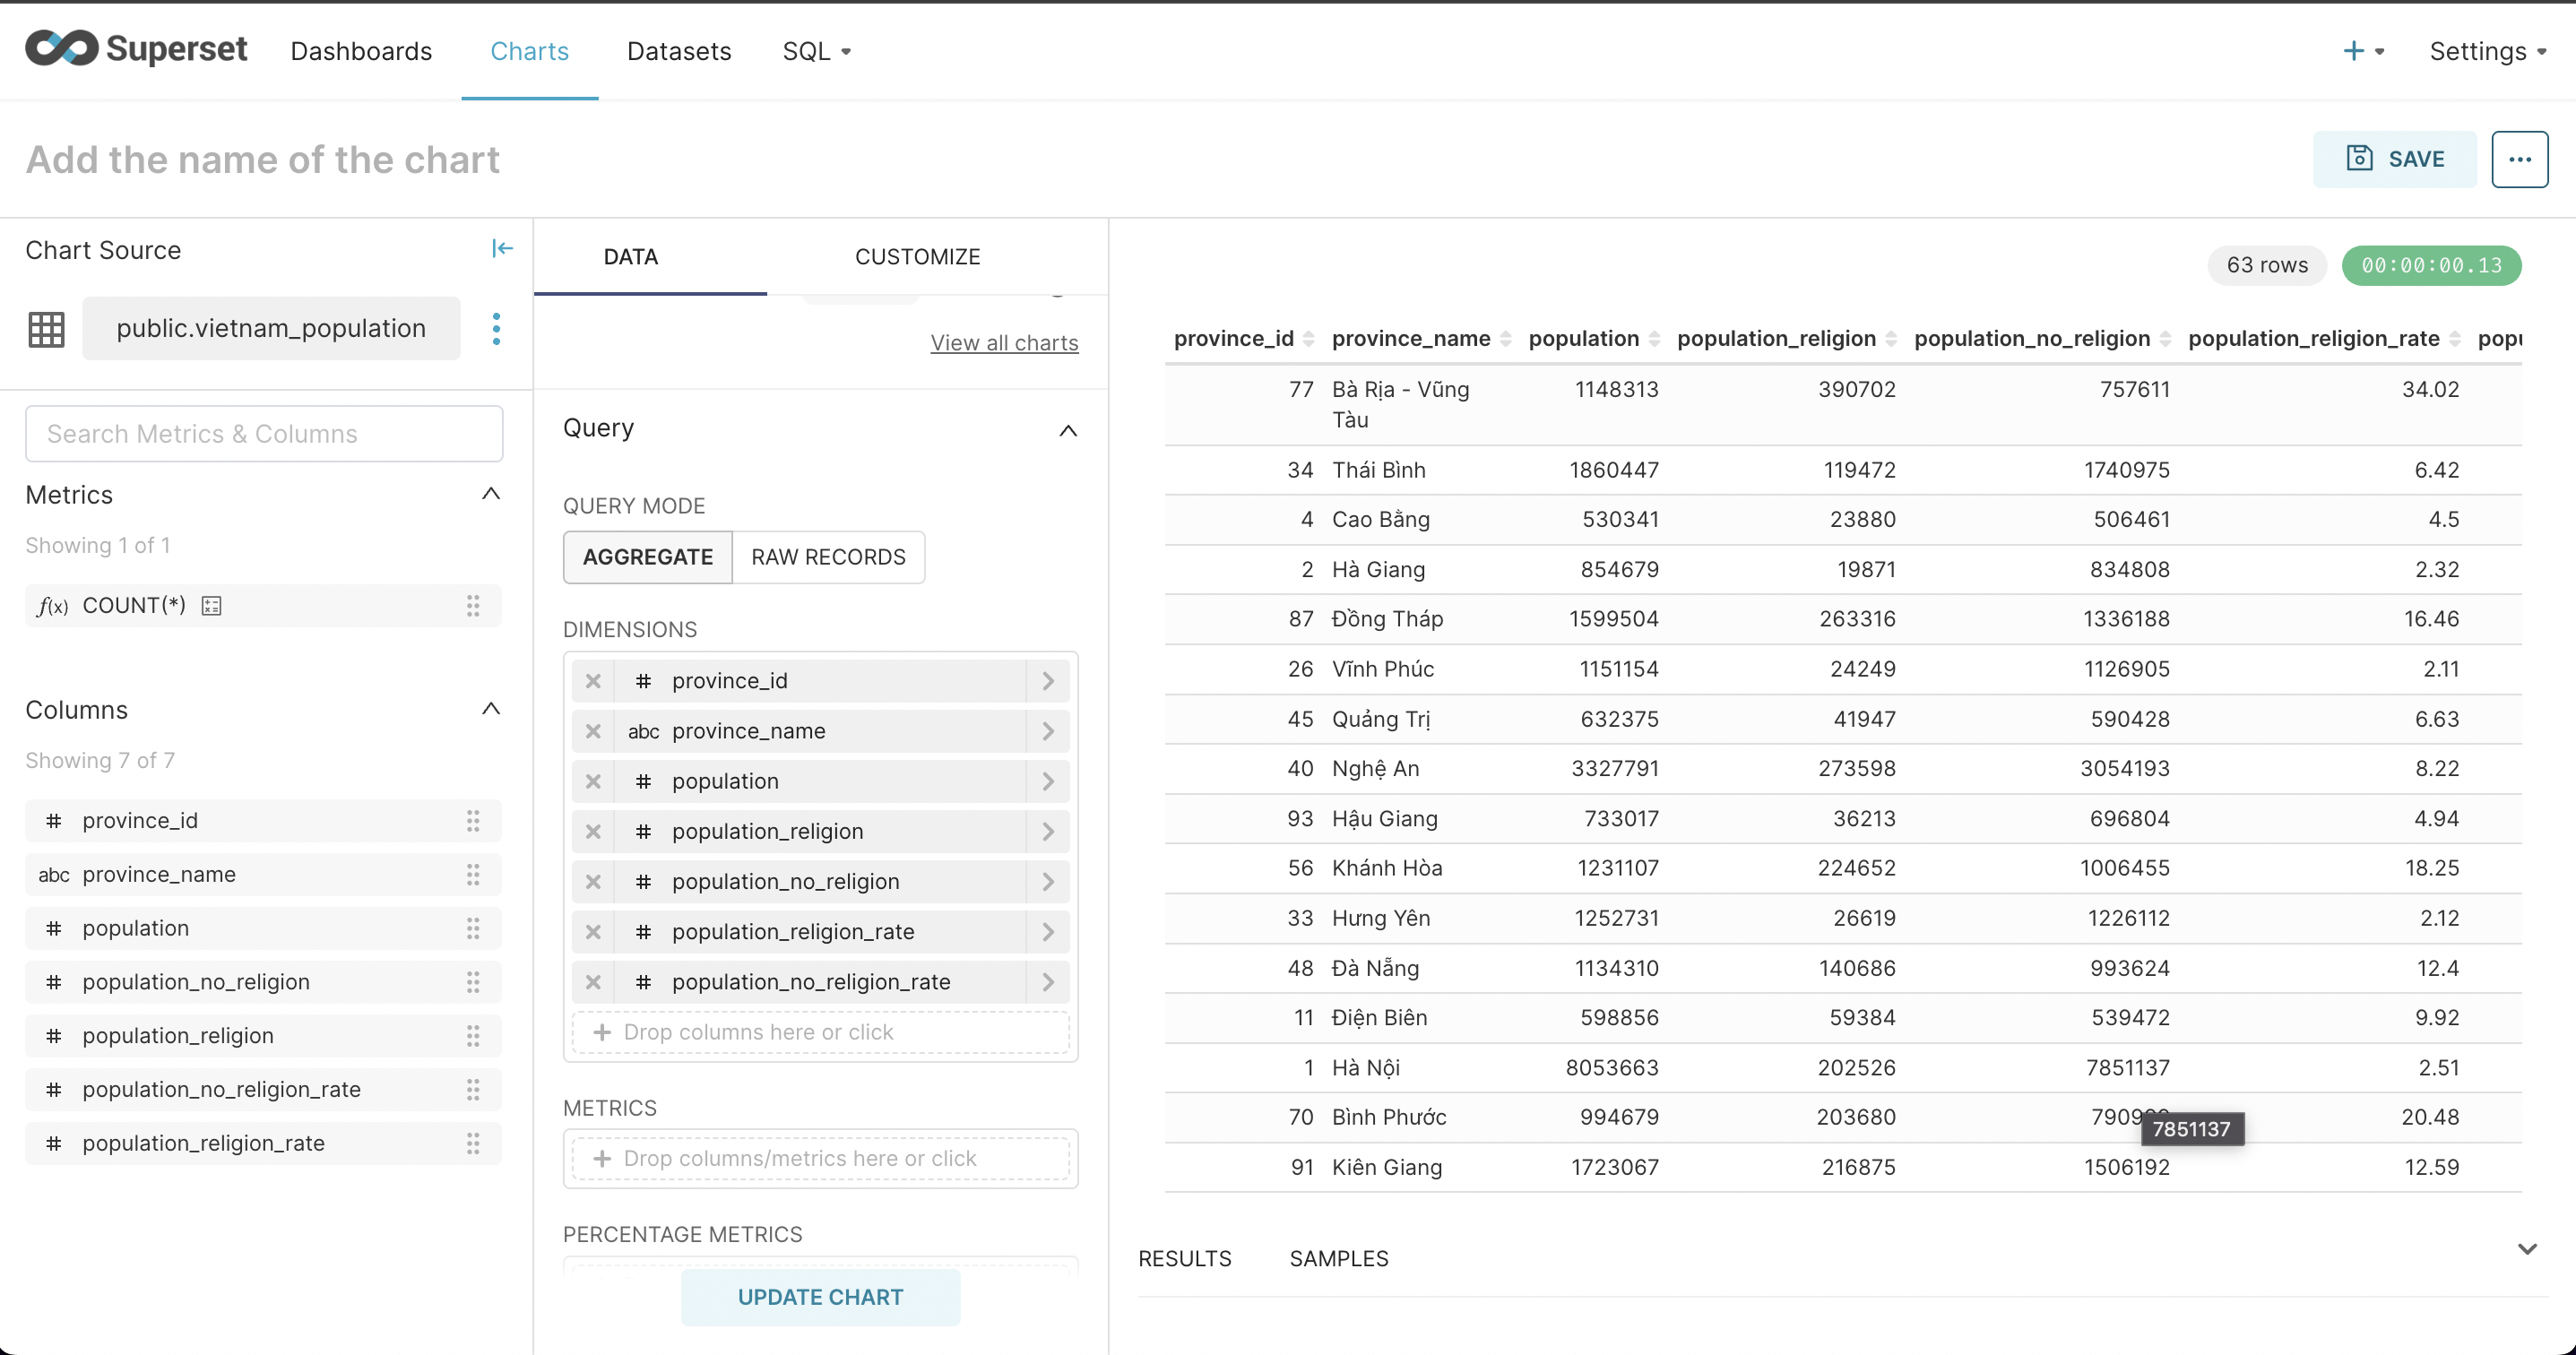
Next, for any chart, you must select Dimension and Metric, depending on each chart, there are mandatory requirements. Here I will choose to list a table with the desired fields.
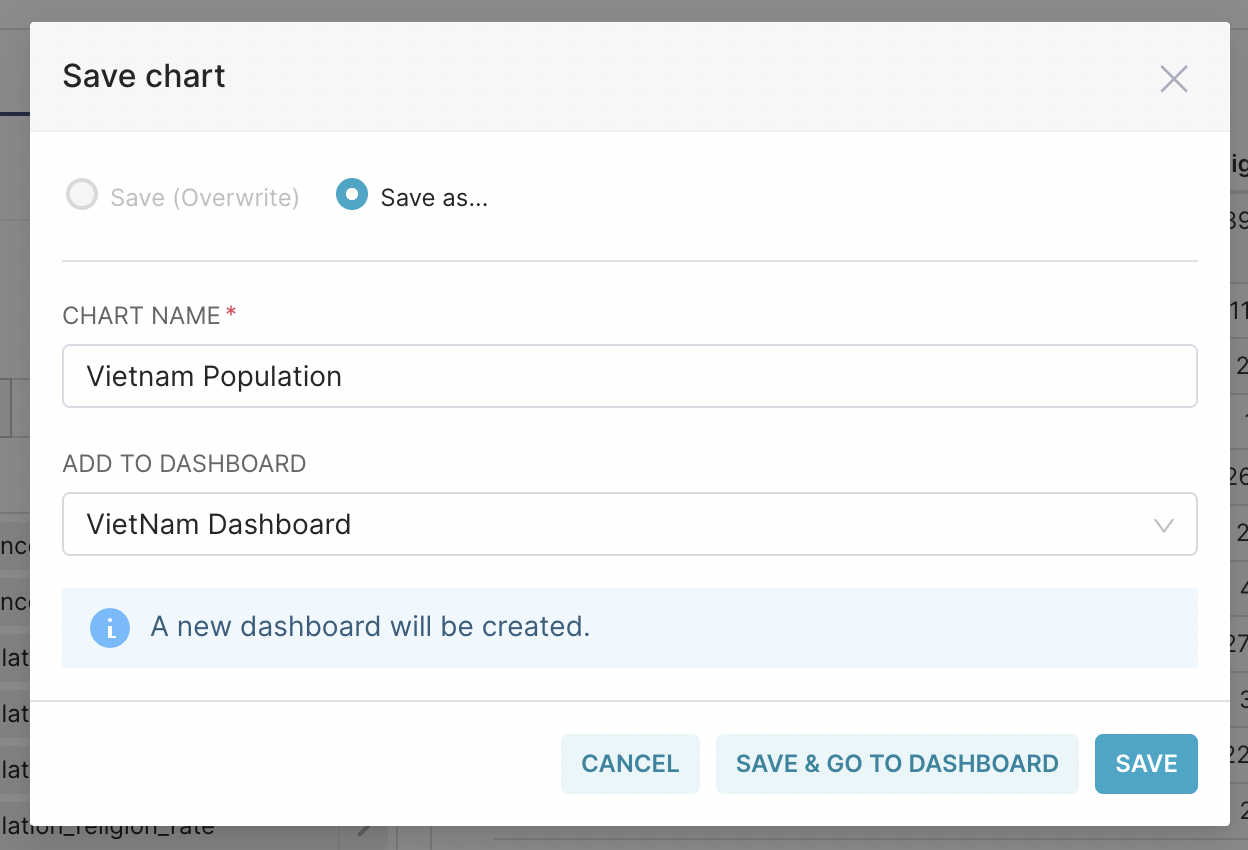
Finally, click Save, and select the Dashboard you want to display the chart on (if the Dashboard does not exist, the system will create a Dashboard and embed the Chart). Click Save & Go to Dashboard
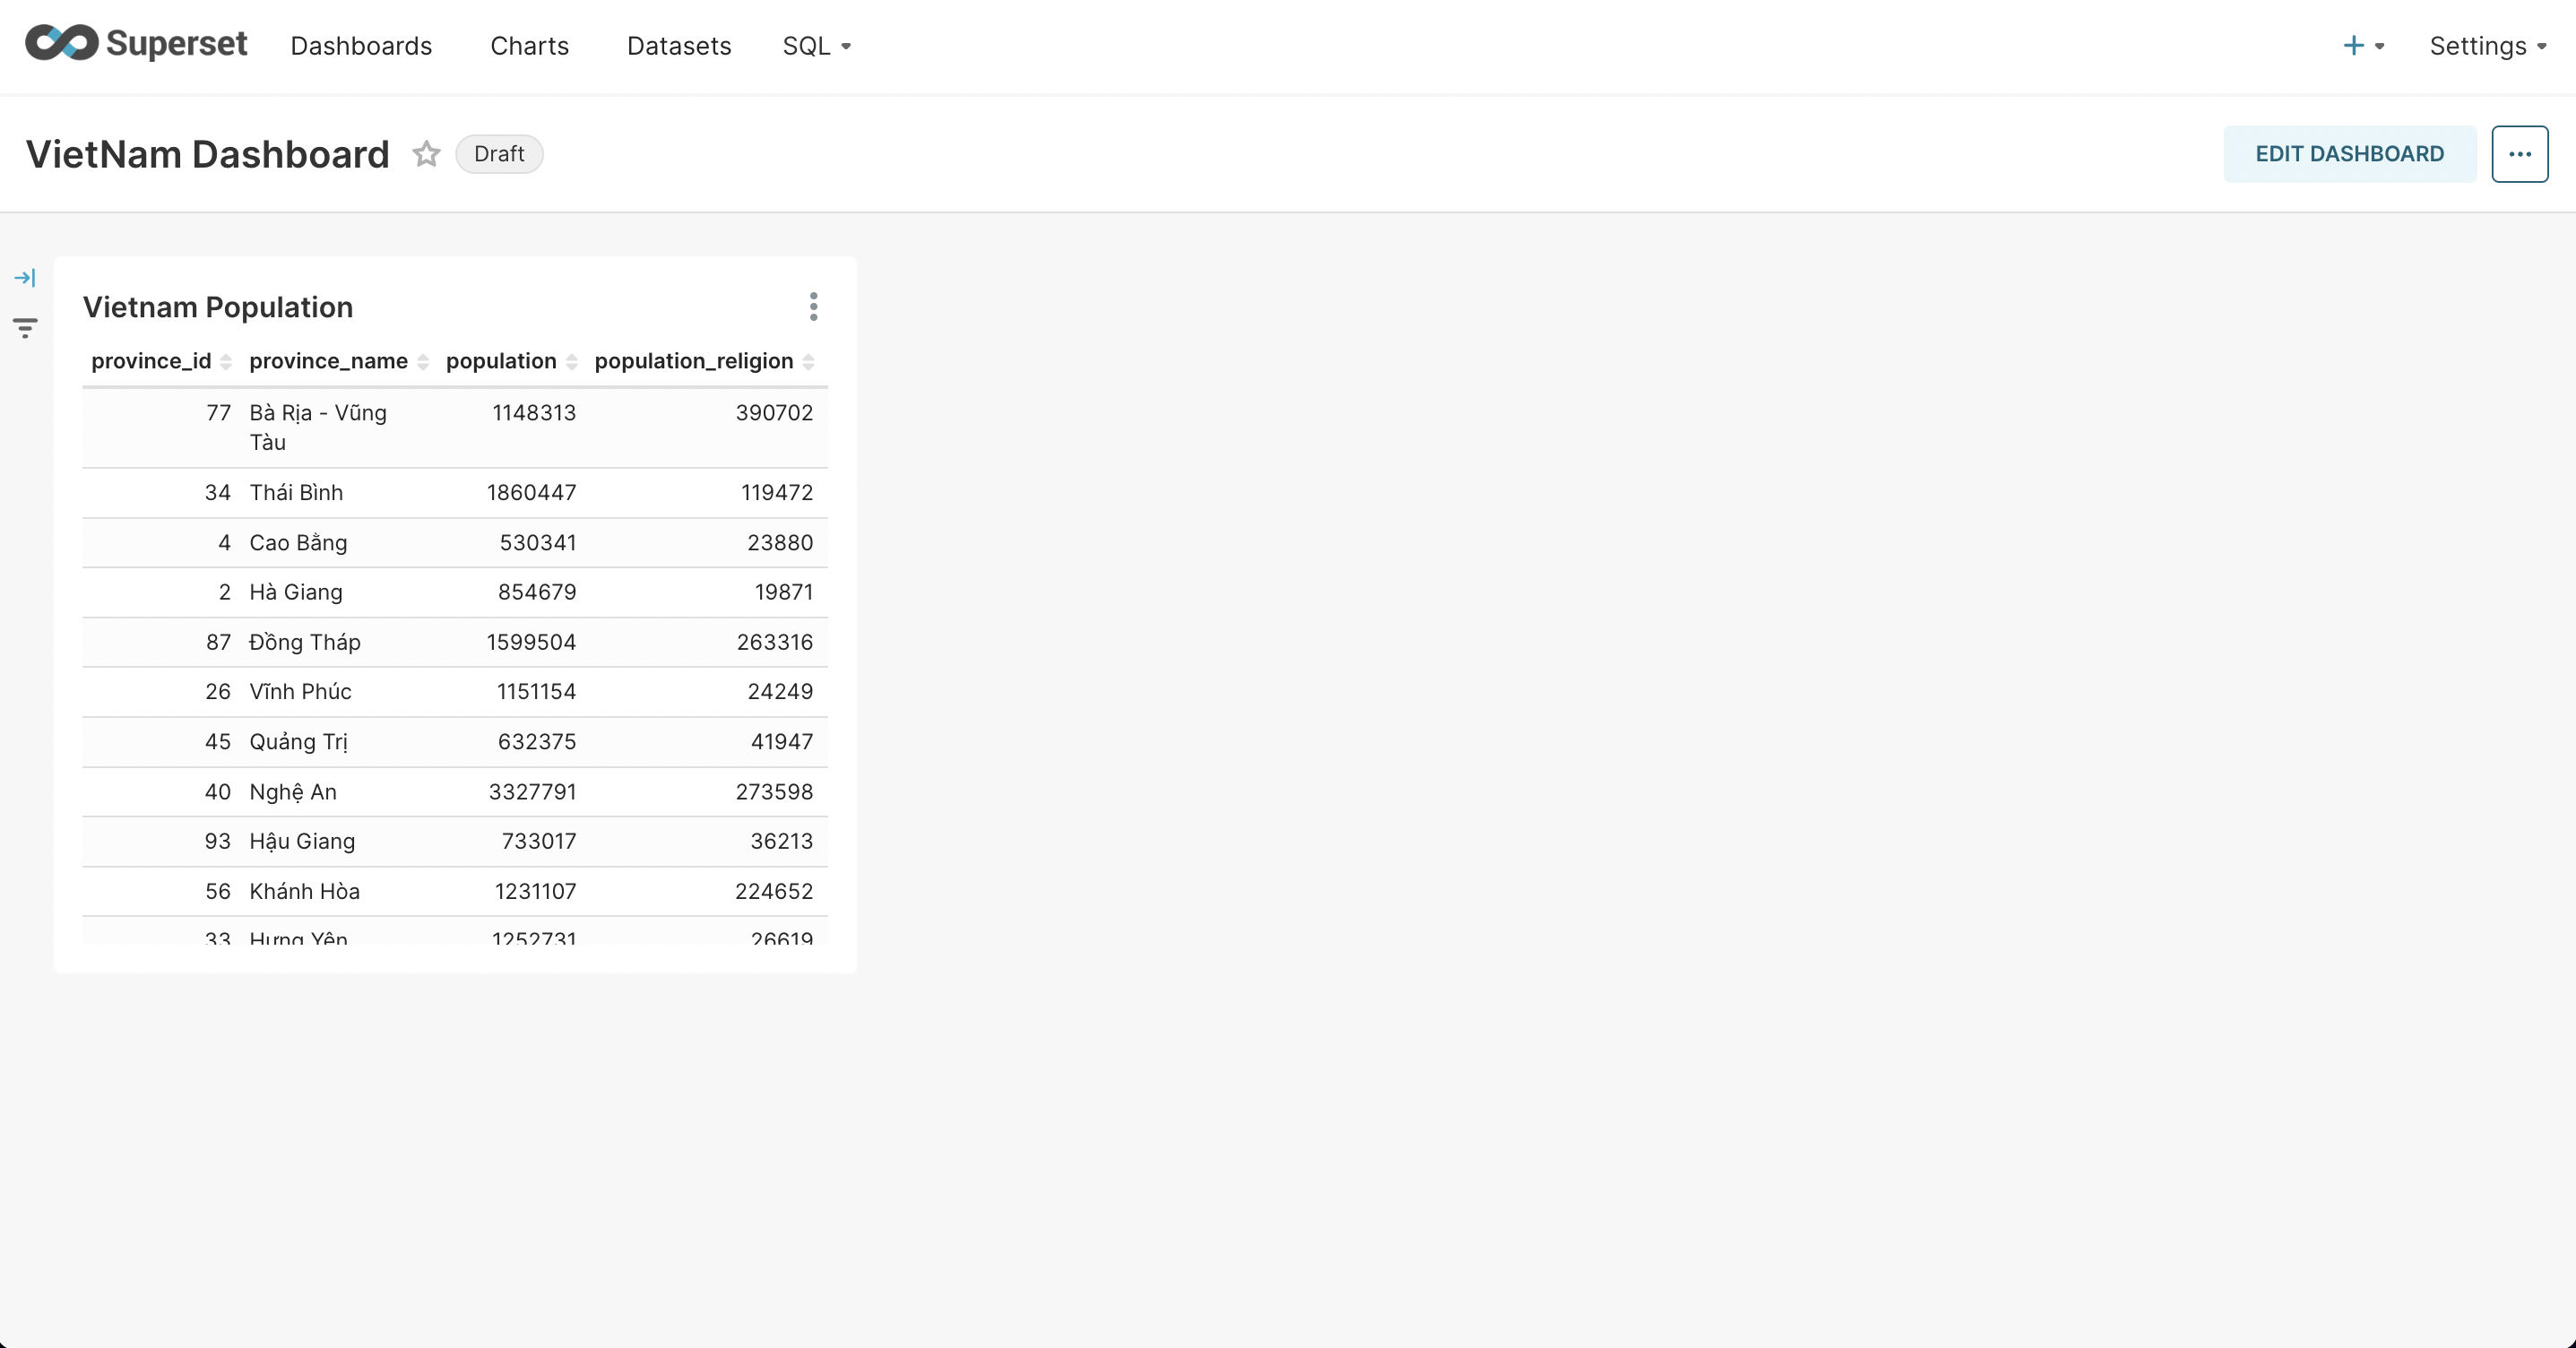
So, you have created a professional Dashboard.
